Best practice and tutorials for enaio from OS and Documentum
Home (Page 9)
Dan Ciruli from EMC will hold a “Hands On Lab” presentation on the Momentum 2012 in Vienna.
The first session is called EMC Documentum xCP 2.0 (Beginner) and will take place on Tuesday, 6th November 2012, 16:30pm – 18:15pm
The second part is just called EMC Documentum xCP 2.0 (Advanced) and will take place on Wednesday, 7th November 2012, 14:00pm – 15:45pm
This will be the first demonstration of xCP 2.0 in EMEA and just before the release of xCP in Q4 of this year.
In this case I defined two simple reports, one as a target (contains the data to be shown in addition of the base report’s data) and the other as a base report (contains the data to be improved by the data from the target report) thereby following the best practice to design the target report first and the base report afterwards. The base report is defined as a table chart type and the target report is defined as a pie chart type.
Data Sources are selected by pulling items from the palette area on the left side into the white area in the middle. After pulling the items there one can select how to query the items and how to treat them in the report.The different items selected and processed here influence what is usable in the next step.
3. Select either Pie, Bar, or Table as the chart type.
Process Reporting Services offers Table by default. Attention: The selection made in step 2 influences what is displayed here. Depending on what you selected before you get different information messages (red text in this screenshot saying: “no data available”)
There are combinations of items that are not compatible with every chart type. In this case an error message is issued warning against the compatibility problem.
If you get error messages there – e.g. “y-axis must be numeric value” -, you will have to change that within Chart Data. There you can steer which data belongs to the different axes. If everything works fine, it should look as follows:
The drill-down itself
First create another simple report which will be the base report. For this follow steps 1 – 3. For a better visualization I chose table type as chart type.
4. Within the Chart Data tab locate the series or column for which you are defining a drill-down report.
Click in the Drilldown field. To find it you must open the columns first:
5. To define a drill-down to another report:
a. Select the Report radio button.
b. Browse to and select a target report.
The report selected here is the one created in steps 1-3. It can be selected from a picklist after creation.
The column the drill-down has been designed for changes in color. So the link to the target report is shown. Clicking on the coloured items take the user to the target report.
c. Click the Filter button(to be found under the drill-down button) to define a filter expression.
d. Select a filter tab and filter tree item and move it to the Filter Expression field by double-clicking.
e. Place your cursor within the single quotes and press the Ctrl and spacebar keys on your keyboard simultaneously. This provides a list of dynamic filter values.
f. Double-click a dynamic filter value and click Ok to close the Filter window.
6. To define a drill-down to a URL, select the URL radio button and enter a URL in the field
provided.
Note: The URL must be absolute and specify the location of a web page in full. For example:
http://www.siteaddress.com.
The result of a functioning drill-down looks as follows: clicking on the changed columns directly takes the user to the drill-down target report. If the drill-down works, it shows in the header like this: base report > target report.
The BAM Server collects events from the audit trail database that occurred 30 seconds in the past. This delay ensures that late arriving audit trail events are collected.
Throughput
This describes the number of transactions the system can process per unit of time.
It is important to execute single-user test for debug and functional tests and multi-user tests for the same business transcations.
Example: concurrent search queries per time interval or the number of simultaneously-viewed documents
Capacity
Capacity is not a fixed value or measurable. Capacity depends on the number of users, the number of business processes, the number of documents and the soft- and hardware configuration.
The capacity must be treated separately:
on the client (Browser)
Application Server
Content Server
Database
and the network bandwidth and latency between the components
xPression Documentum Edition provides organizations the ability to quickly create well-designed, customer-facing multichannel communications with easy-to-use design tools and document templates, while providing a sophisticated layer of control over the entire document generation process. The end-to-end platform leverages existing EMC Documentum investments and provides a single platform for creating, managing, distributing, and archiving all types of customer communications to improve customer experience and speed time-to-market while substantially reducing document development and delivery costs.
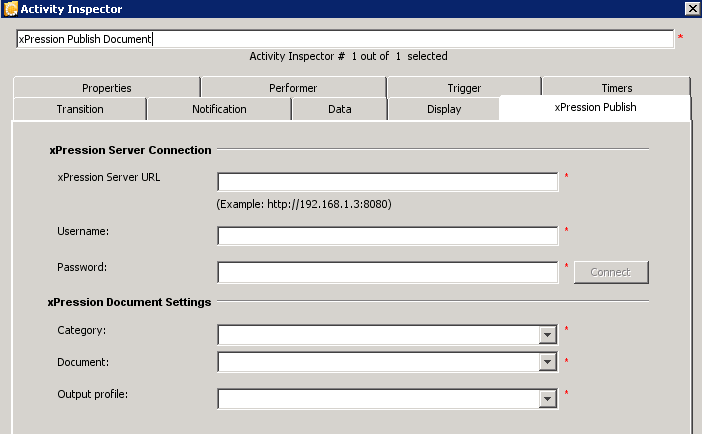
Use the xPression Publish activity template to generate a new document from a Document Sciences xPression document template using data from the process and then map it to a package or an attachment. The variables are replaced with process data when the document is published.
xPression Publish Document – Advanced
Use the xPression Publish Document – Advanced activity template when there are many constant values that must be mapped to process data. Instead of using the data mapper to map each variable, you can type the XML that creates the mappings for constants and adds placeholders for dynamic data. Then use the data mapper to map only the placeholder values that are created by the XML.
Question:
A health organization uses EMC Document Sciences xPression to automate business communications across the enterprise. The process needs to pass a large amnount of stati text and serveral dynamic values to the publishing function to be inserted into the document.
Which Process Builder activity template should be used to meet these requirements?
xPression Publish Document – Mapping
xPression Publish Document – Outbound
xPression Publish Document – Advanced
xPression Publish Document
Answer: xPression Publish Document – Advanced
xPression Publish Document – Mapping and xPression Publish Document – Outbound does not exists as process activity.
xPression Publish Document has no XML functionality. xPression Publish Document – Advanced is correct, because you can use the Customer Data XML property to submit several dynamic values.


 Latency